01.
INTRO
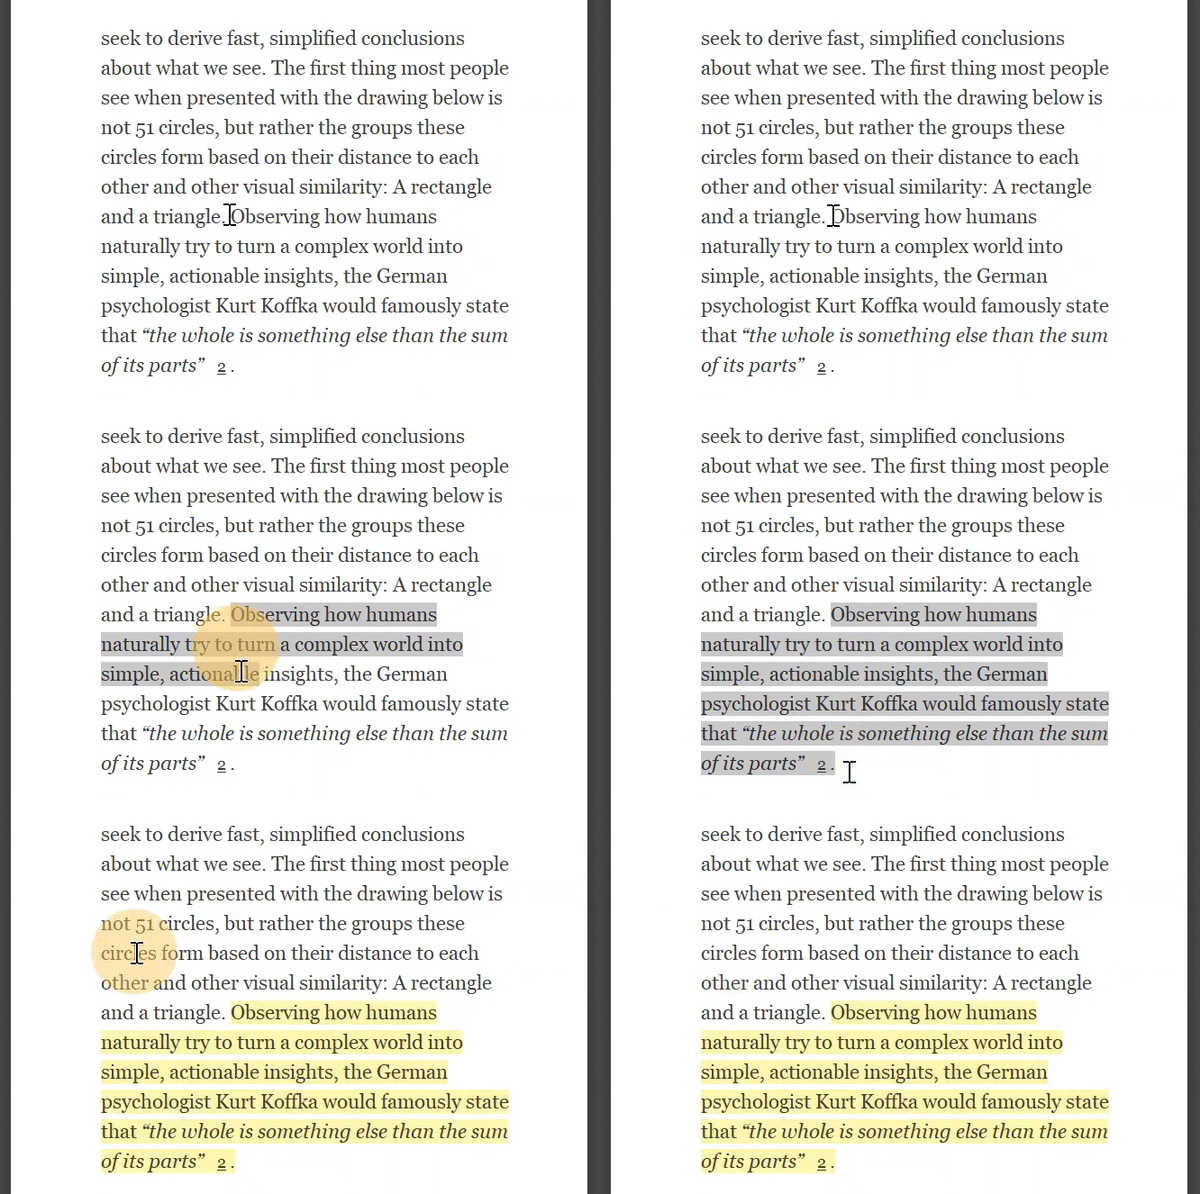
 Fig 0. Highlights from Rune Madsen’s
“Geometric Composition”
Highlighting and annotating — these are techniques for knowledge exploration. Through these techniques we clip information to later revisit, respond, or recombine.
Ethnographers often record multiple sets of time-linked data (e.g. video and audio) on a subject’s interactions with the world around them. They draw insight from these recordings by annotating observations.
ChronoViz is a software tool that streamlines that ethnographic annotation process. However, it currently exists only as an macOS app. My goal is to rethink and build ChronoViz for the web.
Currently I am in the early prototype stage, learning development as I go.
02.
BACKGROUND
What data does ChronoViz analyze?
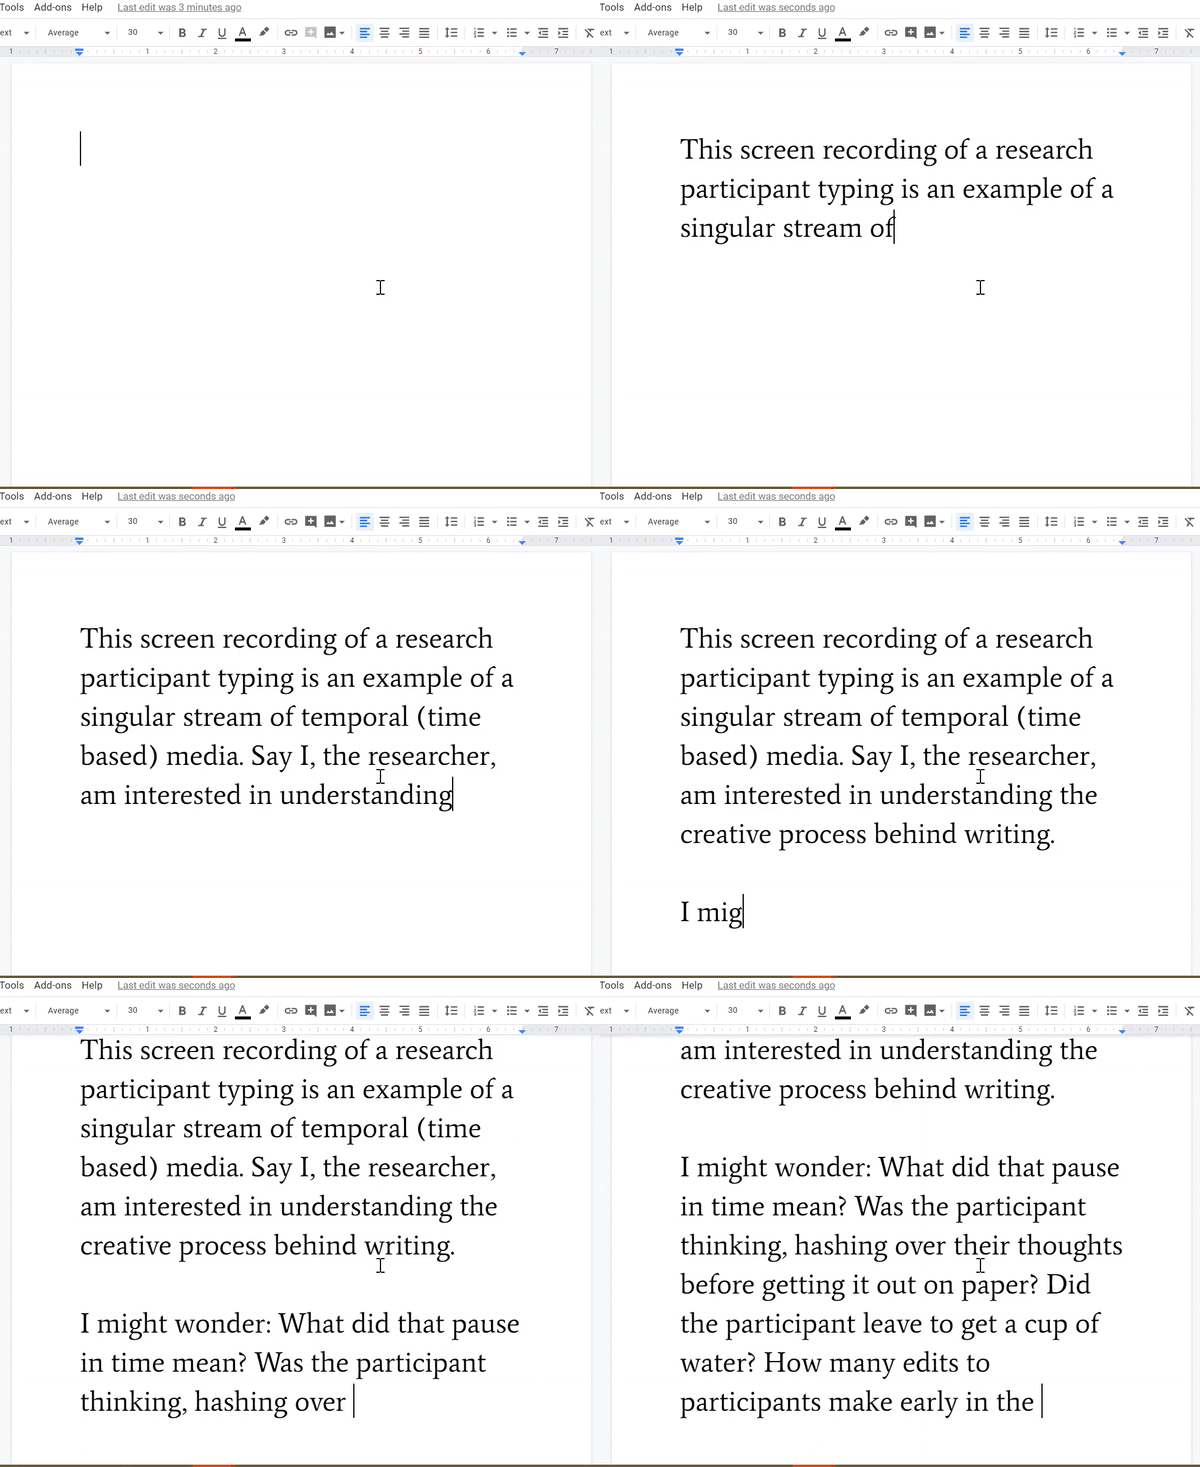
 Fig 1. Screen recordings (video) are an example of
 temporal data. Note the brief pause between paragraphs. Why did the participant stop writing?

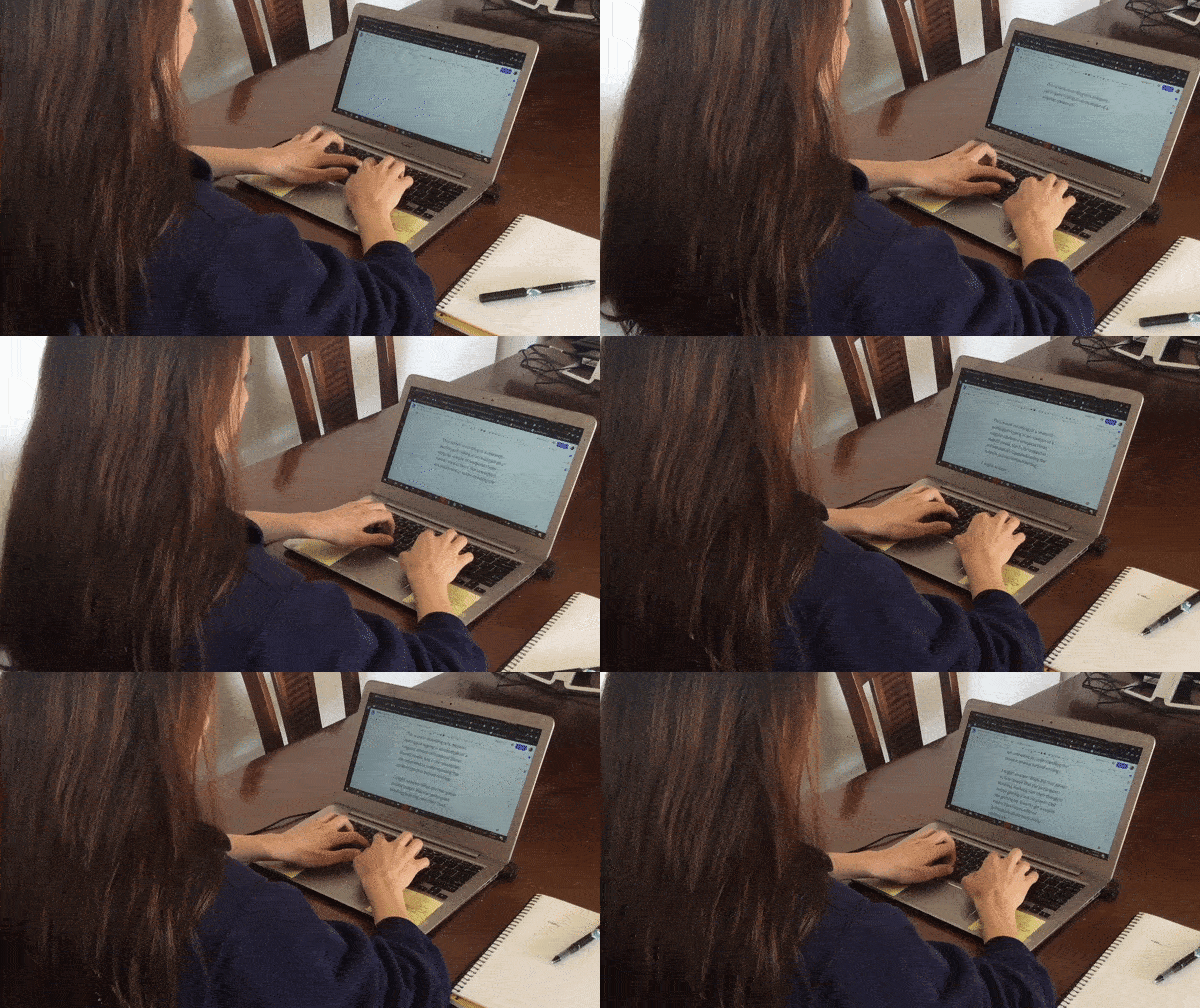
Fig 2. Offscreen view of participant typing. Without this second synced recording, the context around the pause in the first screen (Fig 1) would remain unknown.
Ethnographers often record a single event from multiple angles. Doing so provides a rich dataset that captures not only their research subject, but the context the subject acts within. How are multiple events interlinked? Correlated? Reacting to one another?
03.
PROBLEM SPACE
What problem does ChronoViz solve?
However, manually entering time-stamped annotations is a tedious process full of pain points for even a single stream of temporal data, let alone multiple. The process involves repetitive pausing, video-scrubbing, and typing to capture infinitesimal moments in time:

ChronoViz syncs multiple streams of temporal data together while providing more intuitive input methods for creating annotations.
![]()
Fig 4. The original macOS ChronoViz application, featuring a flight simulation study with multiple videos, a time series graph, audio waveform, and geographic data.
04.
MY ROLE
Due to compability issues with new macOS updates, the original ChronoViz application has fallen out of use. Thus, my goal is to build ChronoViz for the web, focusing upon video data, while exploring the wide space of possibility for additional features and interactions.
The prototype is still under construction, so stay tuned! Currently building out client-facing UI and interaction.
The prototype is still under construction, so stay tuned! Currently building out client-facing UI and interaction.
05.
ARTIFACTS
Working on ChronoViz Web has meant that interactions with time have been heavy on my mind. In this section I share artifacts, sketches, and tangential thoughts amidst the ongoing building process.
Fig 5. Some time-based media (i.e. video) to explore the topic of time-based media.
For example, say you’re taking notes on a Coursera video within a Notion document: once the note-taking process is over, unless you've noted time-stamps, there's no link to the original specific snippet of video you're referencing. The ties between the two artifacts are lost. Compare this to the ability to directly quote a piece of text within your edited document. It’s much harder to capture a specific idea from a podcast or video without a transcript.
Text affords easier annotation. I’m reminded of the two levels of Medium.com comments: inline comments within a blog post, and overall comments available after the blog post. With time-based media, reactions to the whole piece are simple, but reactions to finer-grain snippets are not.
Time as a z-dimension
In the process of thinking about ChronoViz, I have begun to think of videos as 3-dimensional objects, with video frames on a z-axis (time) passing through our computer screen.
![]()
Fig 6. Doodle sketch of ChronoViz feature idea.
Process Sketches!
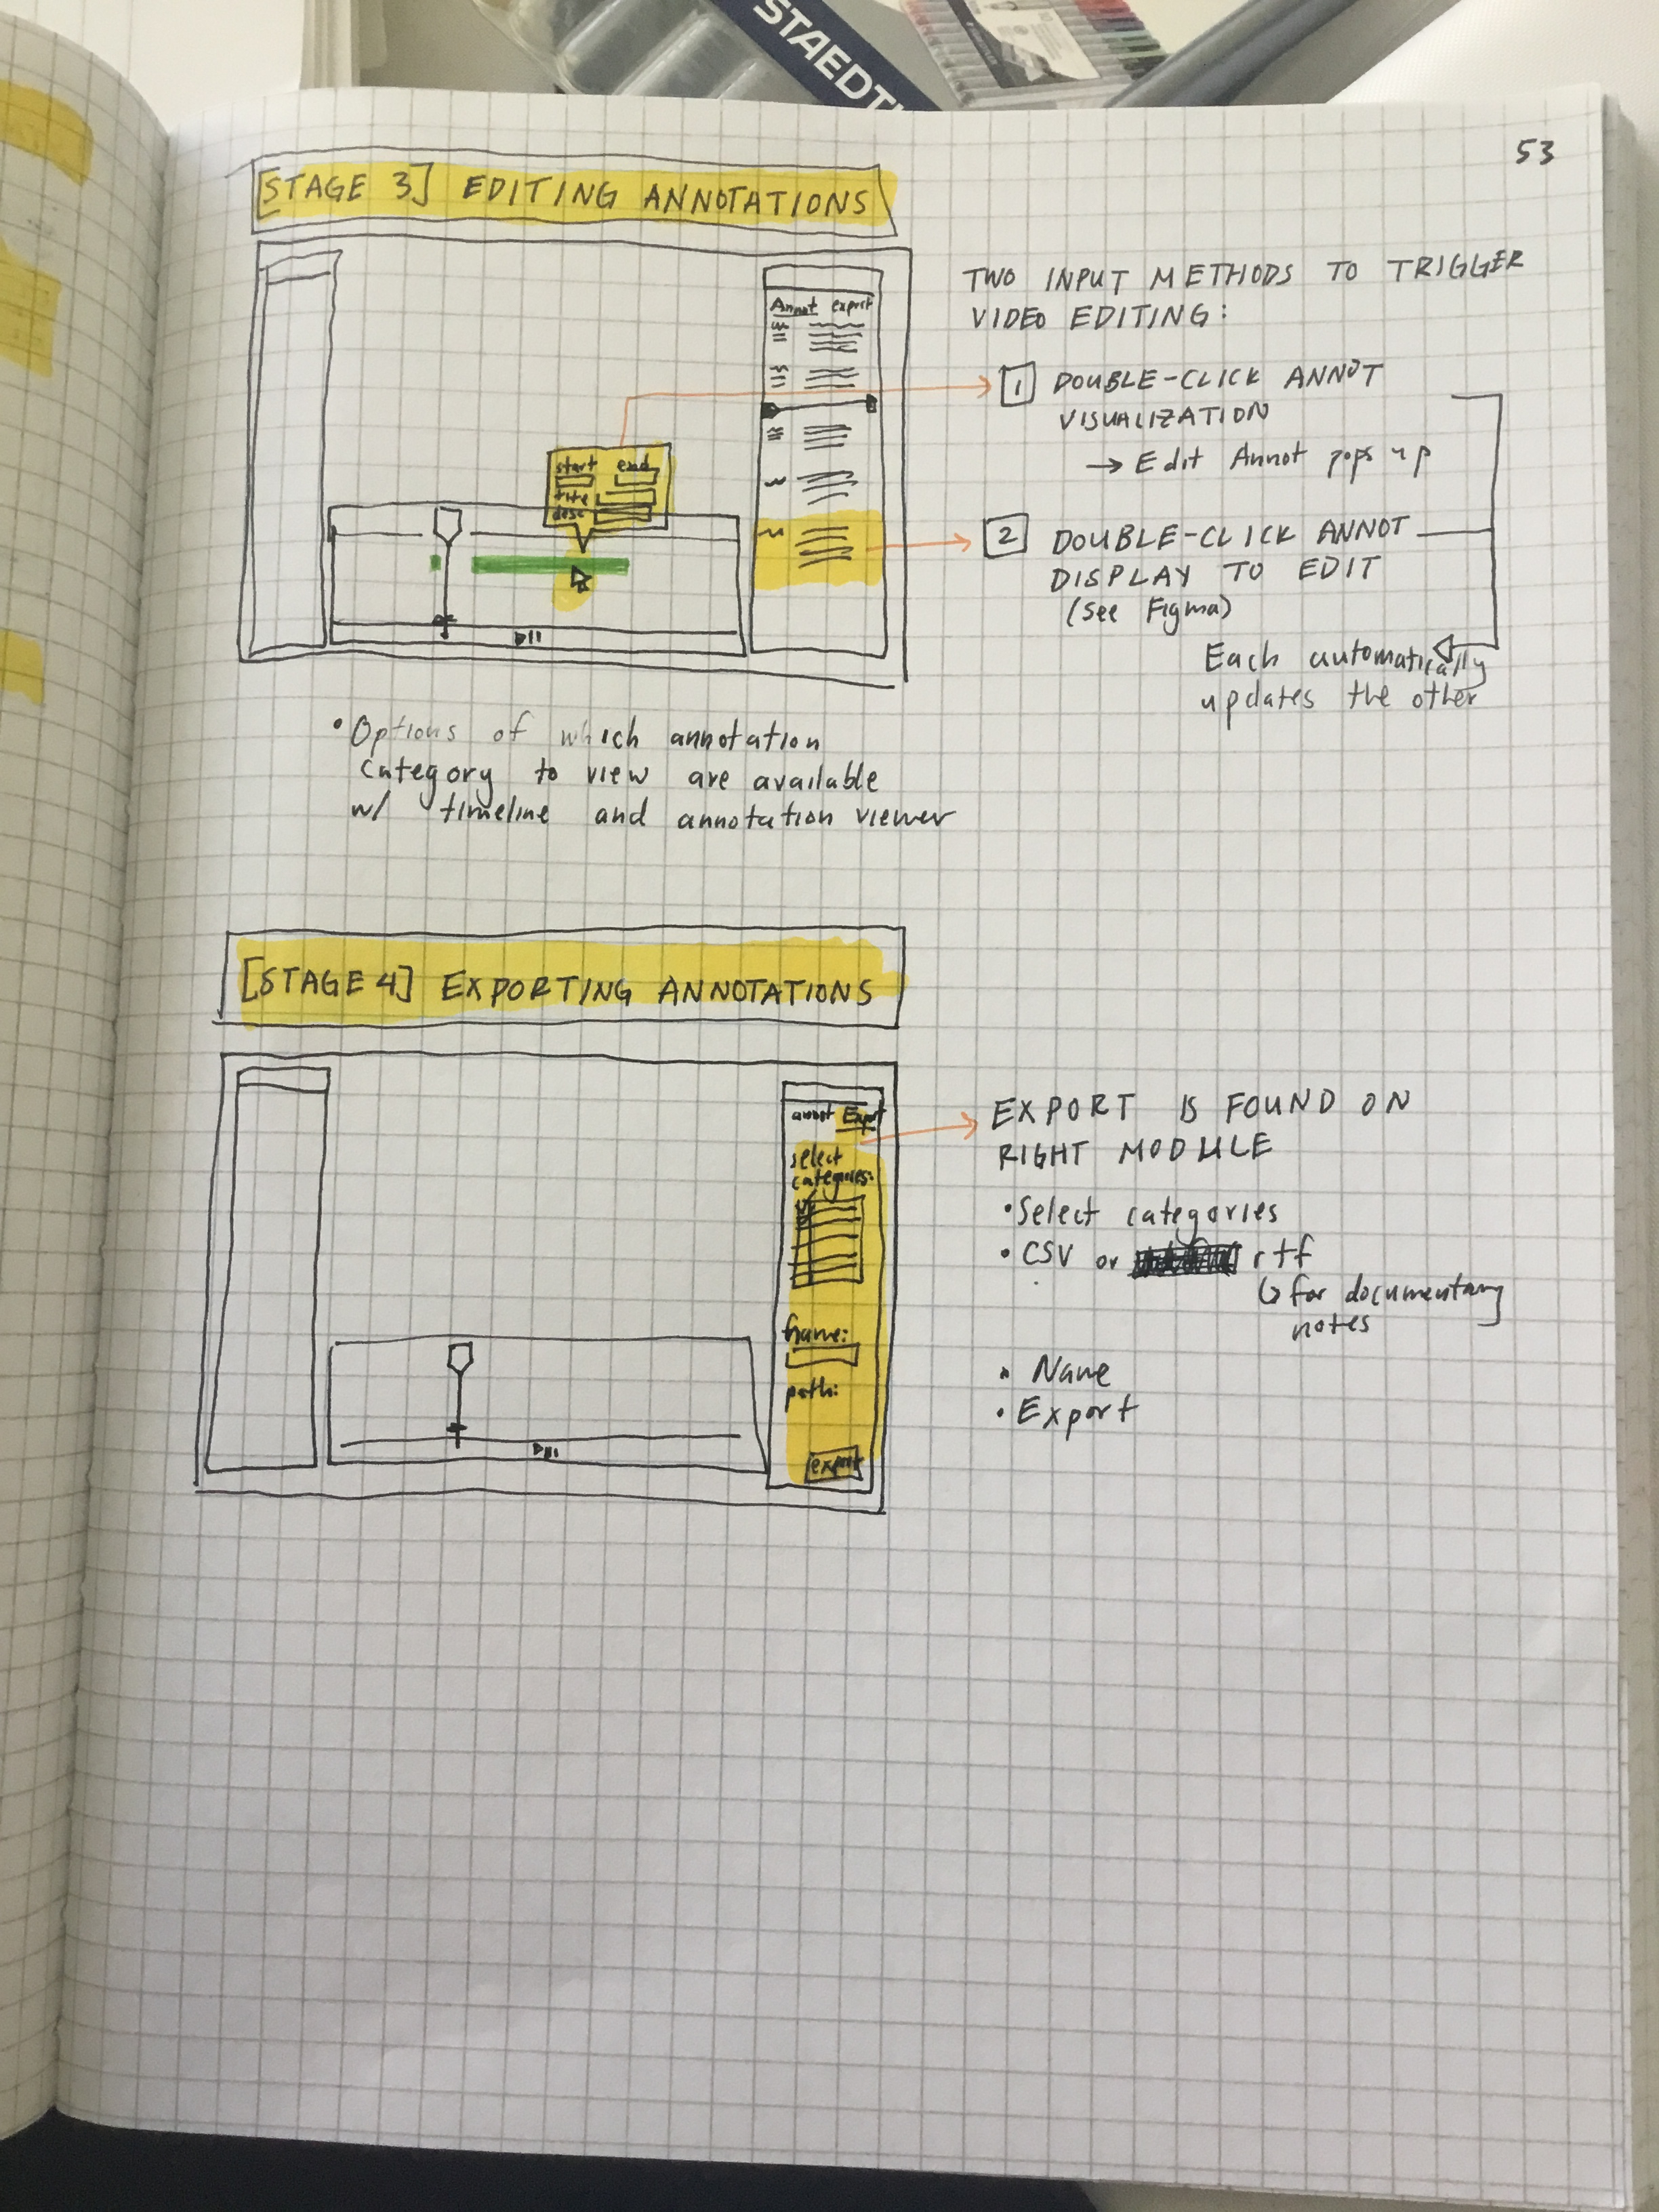
In the process of designing the web-app, I sketched initial ideas onto paper:
1.
Spatially Visualizing Time
There are two ways to spatially visualize change over the course of time: layering and appending.Fig 5. Some time-based media (i.e. video) to explore the topic of time-based media.
2.
Fine-grained annotation is harder for video than text
Note-taking on clippings is a pain point that generalizes across all kinds of time-based media (i.e. podcasts & video).For example, say you’re taking notes on a Coursera video within a Notion document: once the note-taking process is over, unless you've noted time-stamps, there's no link to the original specific snippet of video you're referencing. The ties between the two artifacts are lost. Compare this to the ability to directly quote a piece of text within your edited document. It’s much harder to capture a specific idea from a podcast or video without a transcript.
Text affords easier annotation. I’m reminded of the two levels of Medium.com comments: inline comments within a blog post, and overall comments available after the blog post. With time-based media, reactions to the whole piece are simple, but reactions to finer-grain snippets are not.
3.
Time as a z-dimension
In the process of thinking about ChronoViz, I have begun to think of videos as 3-dimensional objects, with video frames on a z-axis (time) passing through our computer screen. Fig 6. Doodle sketch of ChronoViz feature idea.
4.
Process Sketches!
In the process of designing the web-app, I sketched initial ideas onto paper:


