ChronoViz Web
A software tool for “highlighting” and annotating ranges of time-based media, for ethnographic research.[Page Under Construction]
Skills
Web Development
Interaction Design
Tools
HTML/CSS
JavaScript
Figma
Web Development
Interaction Design
Tools
HTML/CSS
JavaScript
Figma
Overview
ChronoViz Web is a tool that augments a researcher’s ability to observe by allowing them to seamlessly annotate multiple videos at once. I am currently in the process of designing and developing an early prototype.
INTRO
Who am I designing for?
Research ethnographers often record a single event from multiple angles. Doing so provides a rich dataset that captures not only their research subject, but the context the subject acts within. How are multiple events interlinked? Correlated? Reacting to one another?
After a session of field work, their data often looks like this — multiple streams of video data:
![]()
Research ethnographers often record a single event from multiple angles. Doing so provides a rich dataset that captures not only their research subject, but the context the subject acts within. How are multiple events interlinked? Correlated? Reacting to one another?
After a session of field work, their data often looks like this — multiple streams of video data:

 Fig 1. Screen recordings (video) are an example of temporal data.
 Note the brief pause between paragraphs. Why did the participant stop writing?
Fig 2. Offscreen view of participant typing, pausing to think.
Without this second synced recording, the reason behind the paused typing in the first screen (Fig 1) would remain unknown.
PROBLEM
Annotating temporal data poses unique challenges. Therefore tools behavioral researchers have available for data analysis do not afford for easy annotation of multiple streams of temporal data, like audio and video.
Annotating temporal data poses unique challenges. Therefore tools behavioral researchers have available for data analysis do not afford for easy annotation of multiple streams of temporal data, like audio and video.
WHY I LOVE THIS PROJECT
--
--
GOAL
My goal is to design and develop a web tool that allows researchers to:
Play multiple videos at once,
AND make annotations in the same window,
AND visualize those annotations on a timeline,
AND add descriptions and tags to annotations,
Eliminating tedium for a more seamless video-analysis process.
My goal is to design and develop a web tool that allows researchers to:
Play multiple videos at once,
AND make annotations in the same window,
AND visualize those annotations on a timeline,
AND add descriptions and tags to annotations,
Eliminating tedium for a more seamless video-analysis process.
RESPONSIBILITIES
As the sole designer-developer, my role spans multiple domains:
💻 Building a v1 early prototype version of the application in JavaScript,
✒️ Designing the user flow and features in Figma,
💬 And soliciting feedback from Design Lab ethnographers by designing and coordinating user testing.
As the sole designer-developer, my role spans multiple domains:
💻 Building a v1 early prototype version of the application in JavaScript,
✒️ Designing the user flow and features in Figma,
💬 And soliciting feedback from Design Lab ethnographers by designing and coordinating user testing.
Problem Space
01.
Stakeholders
Who am I designing for?
Our main stakeholders are research ethnographers. Take for example, Colleen Emmeneger, an ethnographer studying interactions between pedestrians and autonomous vehicles.
Primary Stakeholders: Research Ethnographers
Colleen Emmenneger
• Ethnographer of 10+ years experience
• Multiple cameras set up, facing driver and road, and stationary cameras set up at intersections
Primary Stakeholders: Research Ethnographers
Colleen Emmenneger
• Ethnographer of 10+ years experience
• Multiple cameras set up, facing driver and road, and stationary cameras set up at intersections
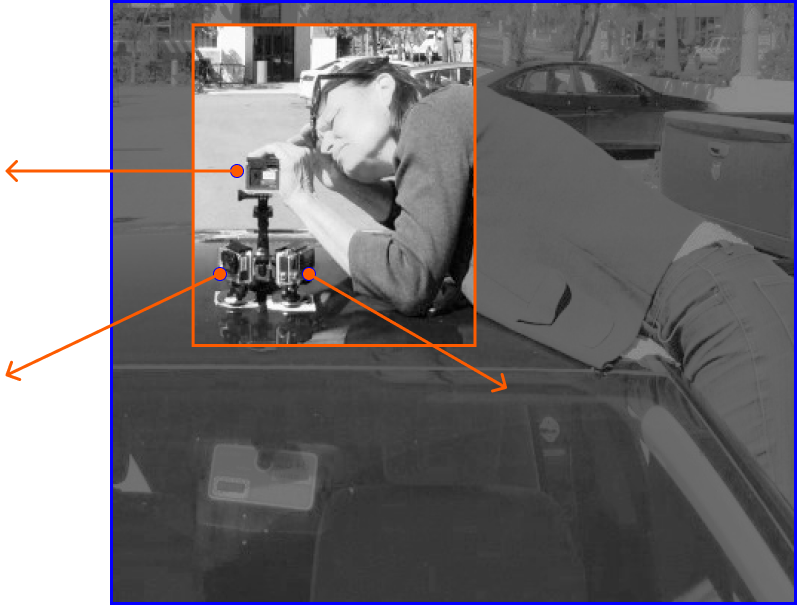
Colleen ft. her three-camera set up
Secondary Stakeholders: Research Assistants
Oftentimes other individuals will also annotate the same set of videos to ensure inter-coder reliability.
Oftentimes other individuals will also annotate the same set of videos to ensure inter-coder reliability.
02.
Landscape Analysis
What tools does Colleen have at her disposal?
Post-study, Colleen wants to annotate these simultaneous video streams to note waves, nods, body language, etc.
What tools does she have at her disposal?
As you can see, a range of solutions exist, but either the lack of automation makes for a tedious experience, the software is not OS-agnostic, or the software has a learning curve too complex for lighter-weight use cases.
What tools does she have at her disposal?
As you can see, a range of solutions exist, but either the lack of automation makes for a tedious experience, the software is not OS-agnostic, or the software has a learning curve too complex for lighter-weight use cases.
03.
Goal
Solution?ChronoViz aims to fill the middle ground by:
1. Providing automated features such as multi-media playing and annotation.
2. Being OS-agnostic through development via web.
3. Reducing the learning curve with a relatively simple and intuitive workflow.
1. Providing automated features such as multi-media playing and annotation.
2. Being OS-agnostic through development via web.
3. Reducing the learning curve with a relatively simple and intuitive workflow.
Process
01.
User Journey
Feature identification
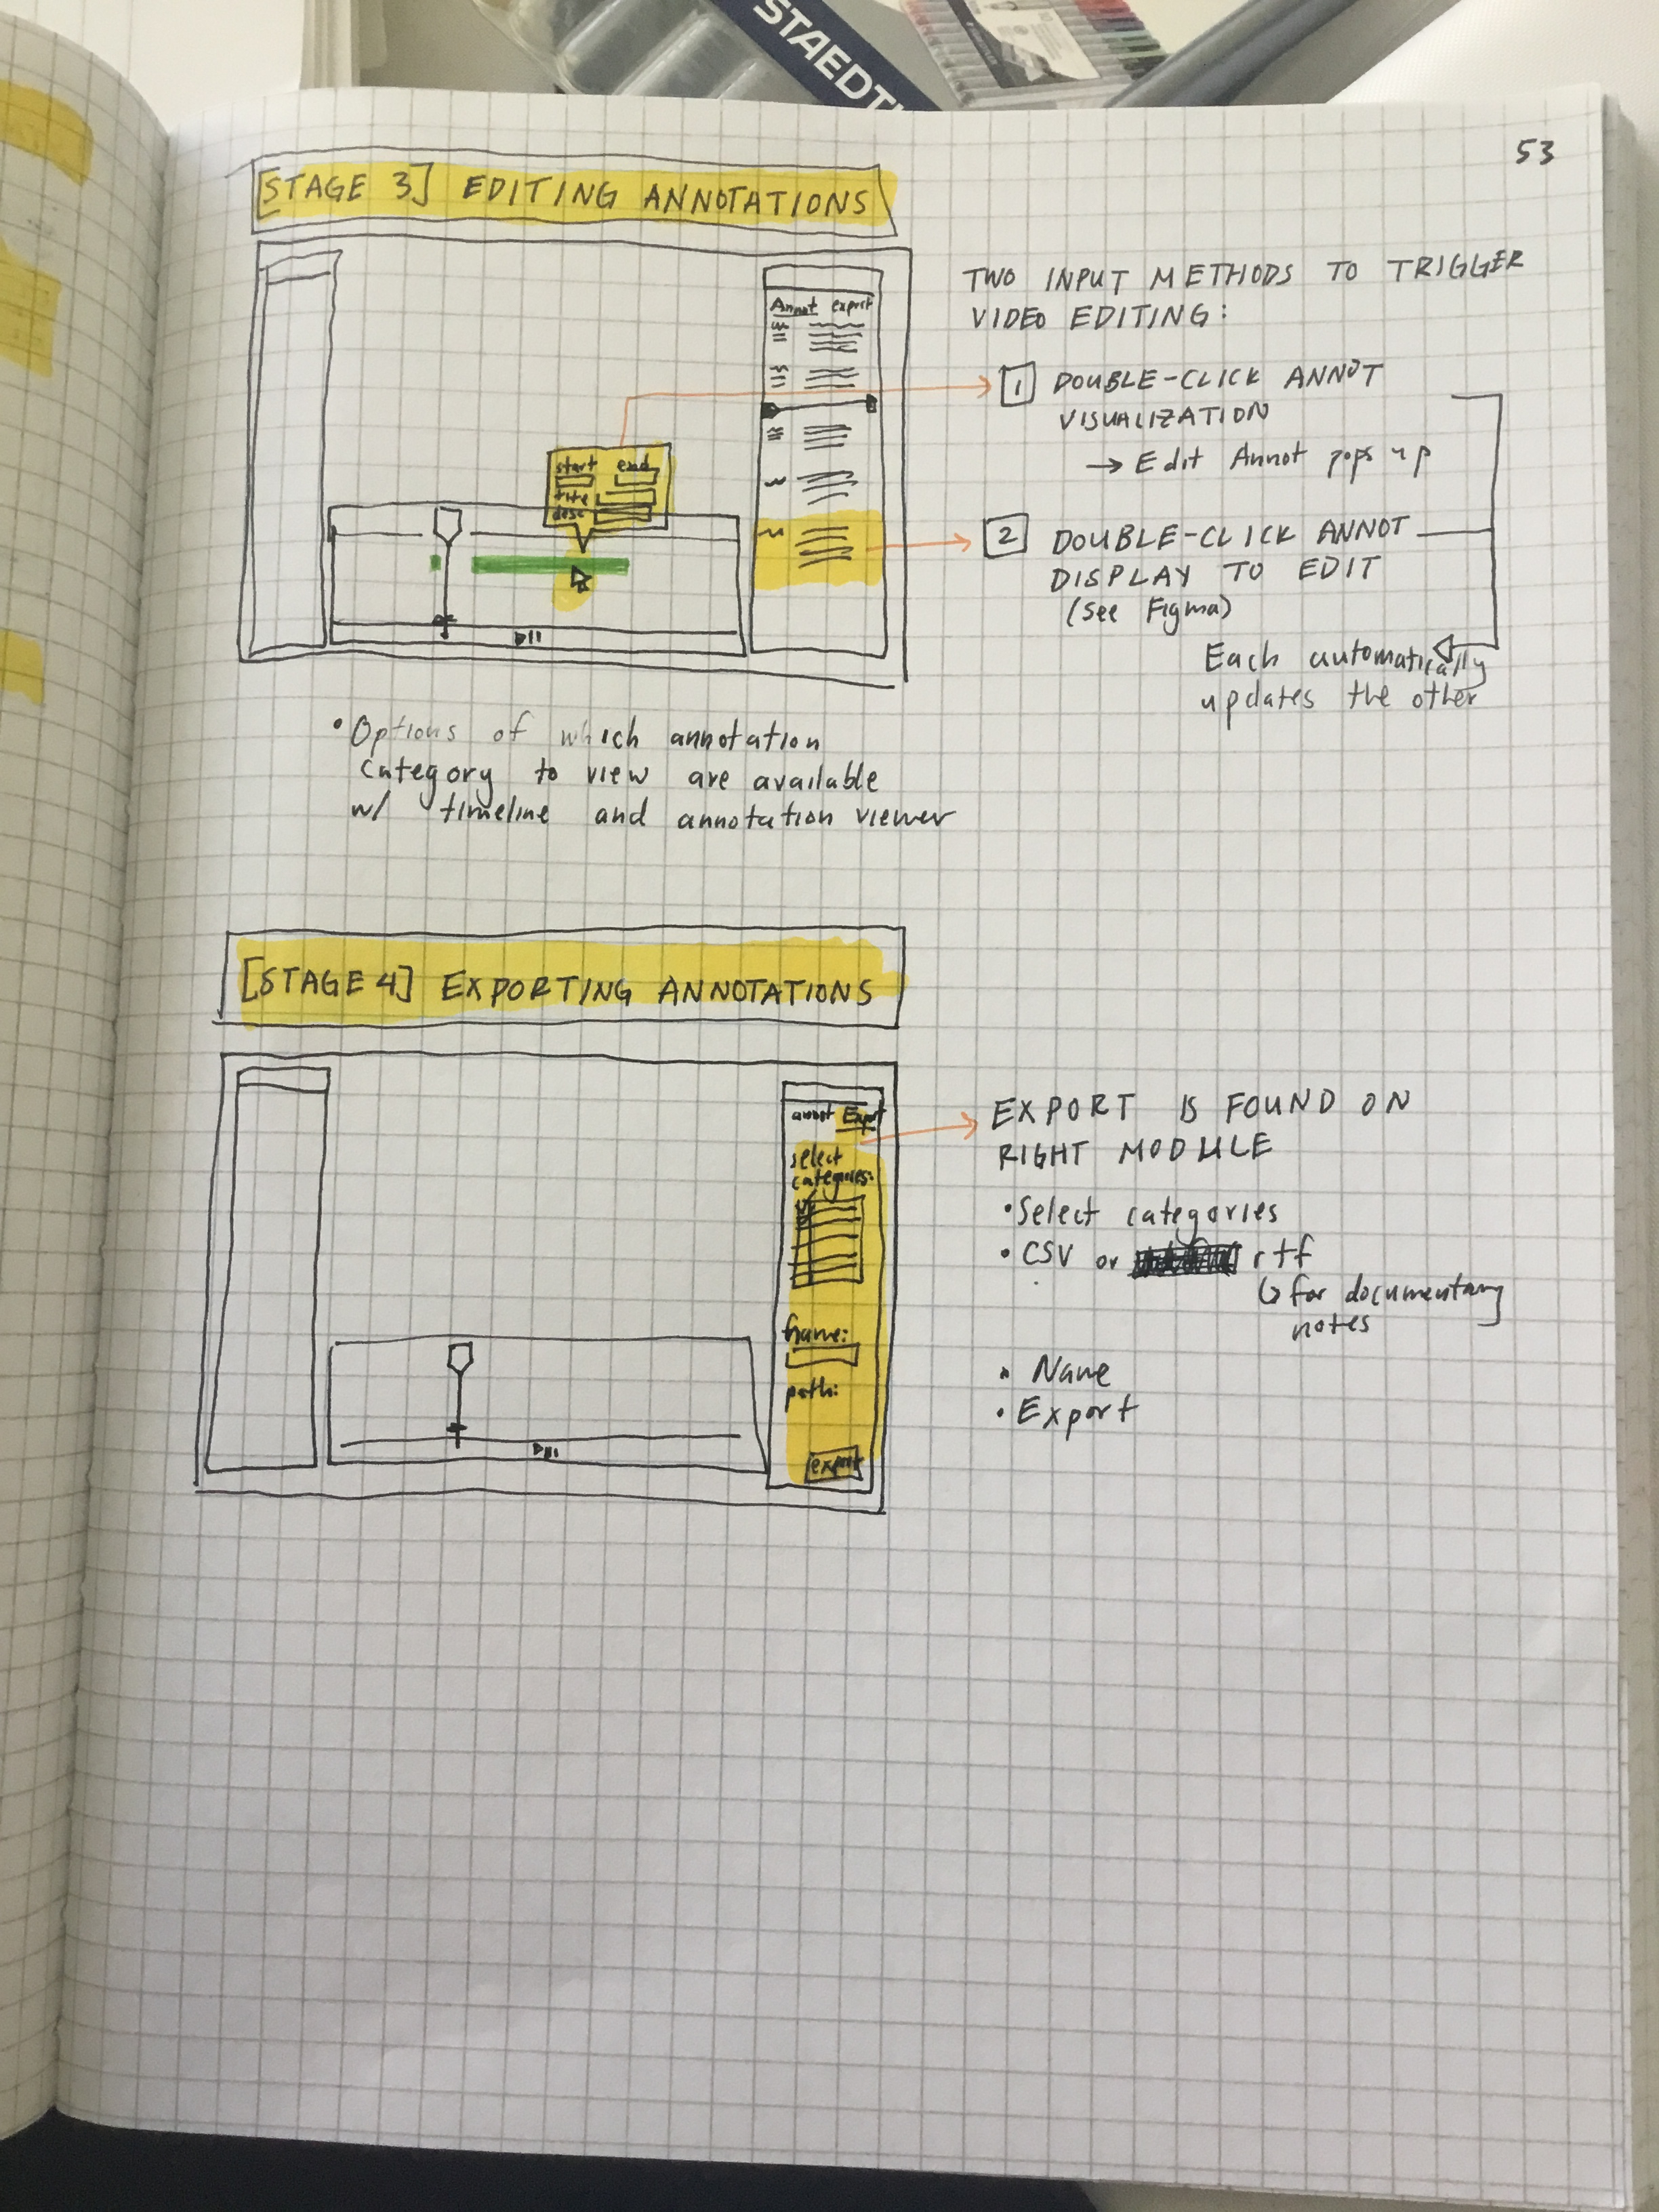
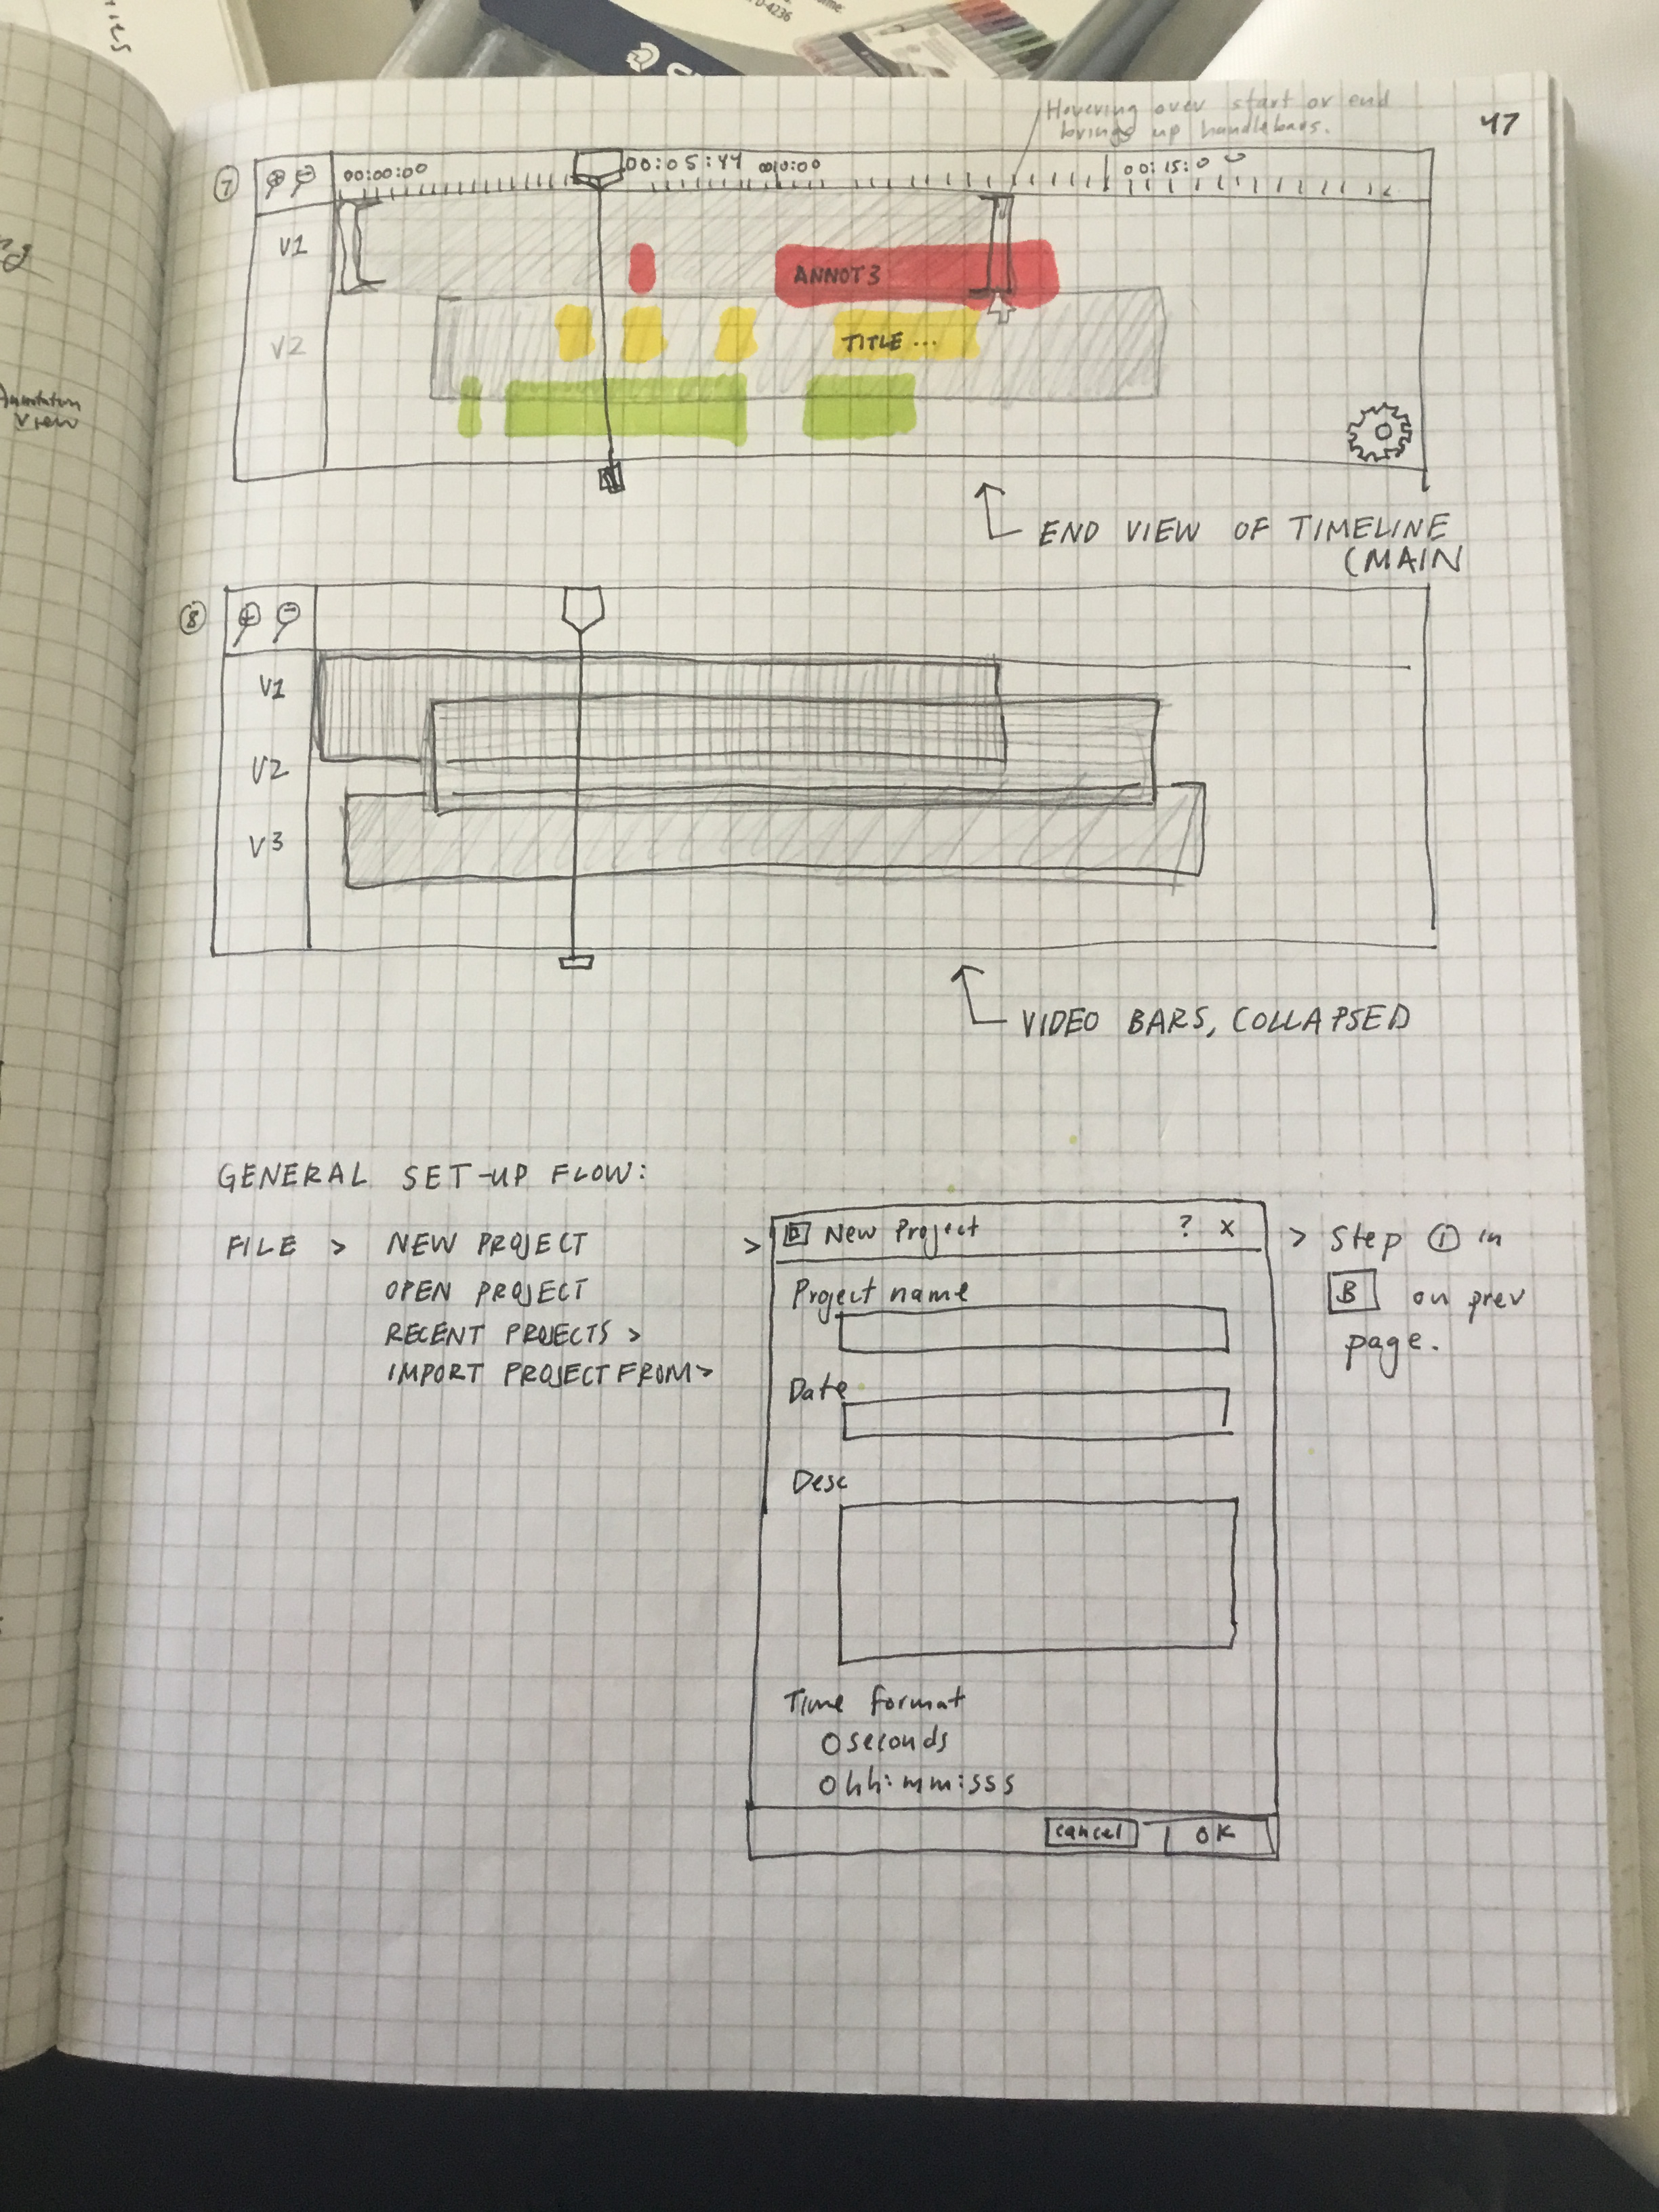
I began by identifying a frame for the main user flow, allowing me to break down each stage into sub-features:
![]()

02.
Low-Fidelity Prototyping
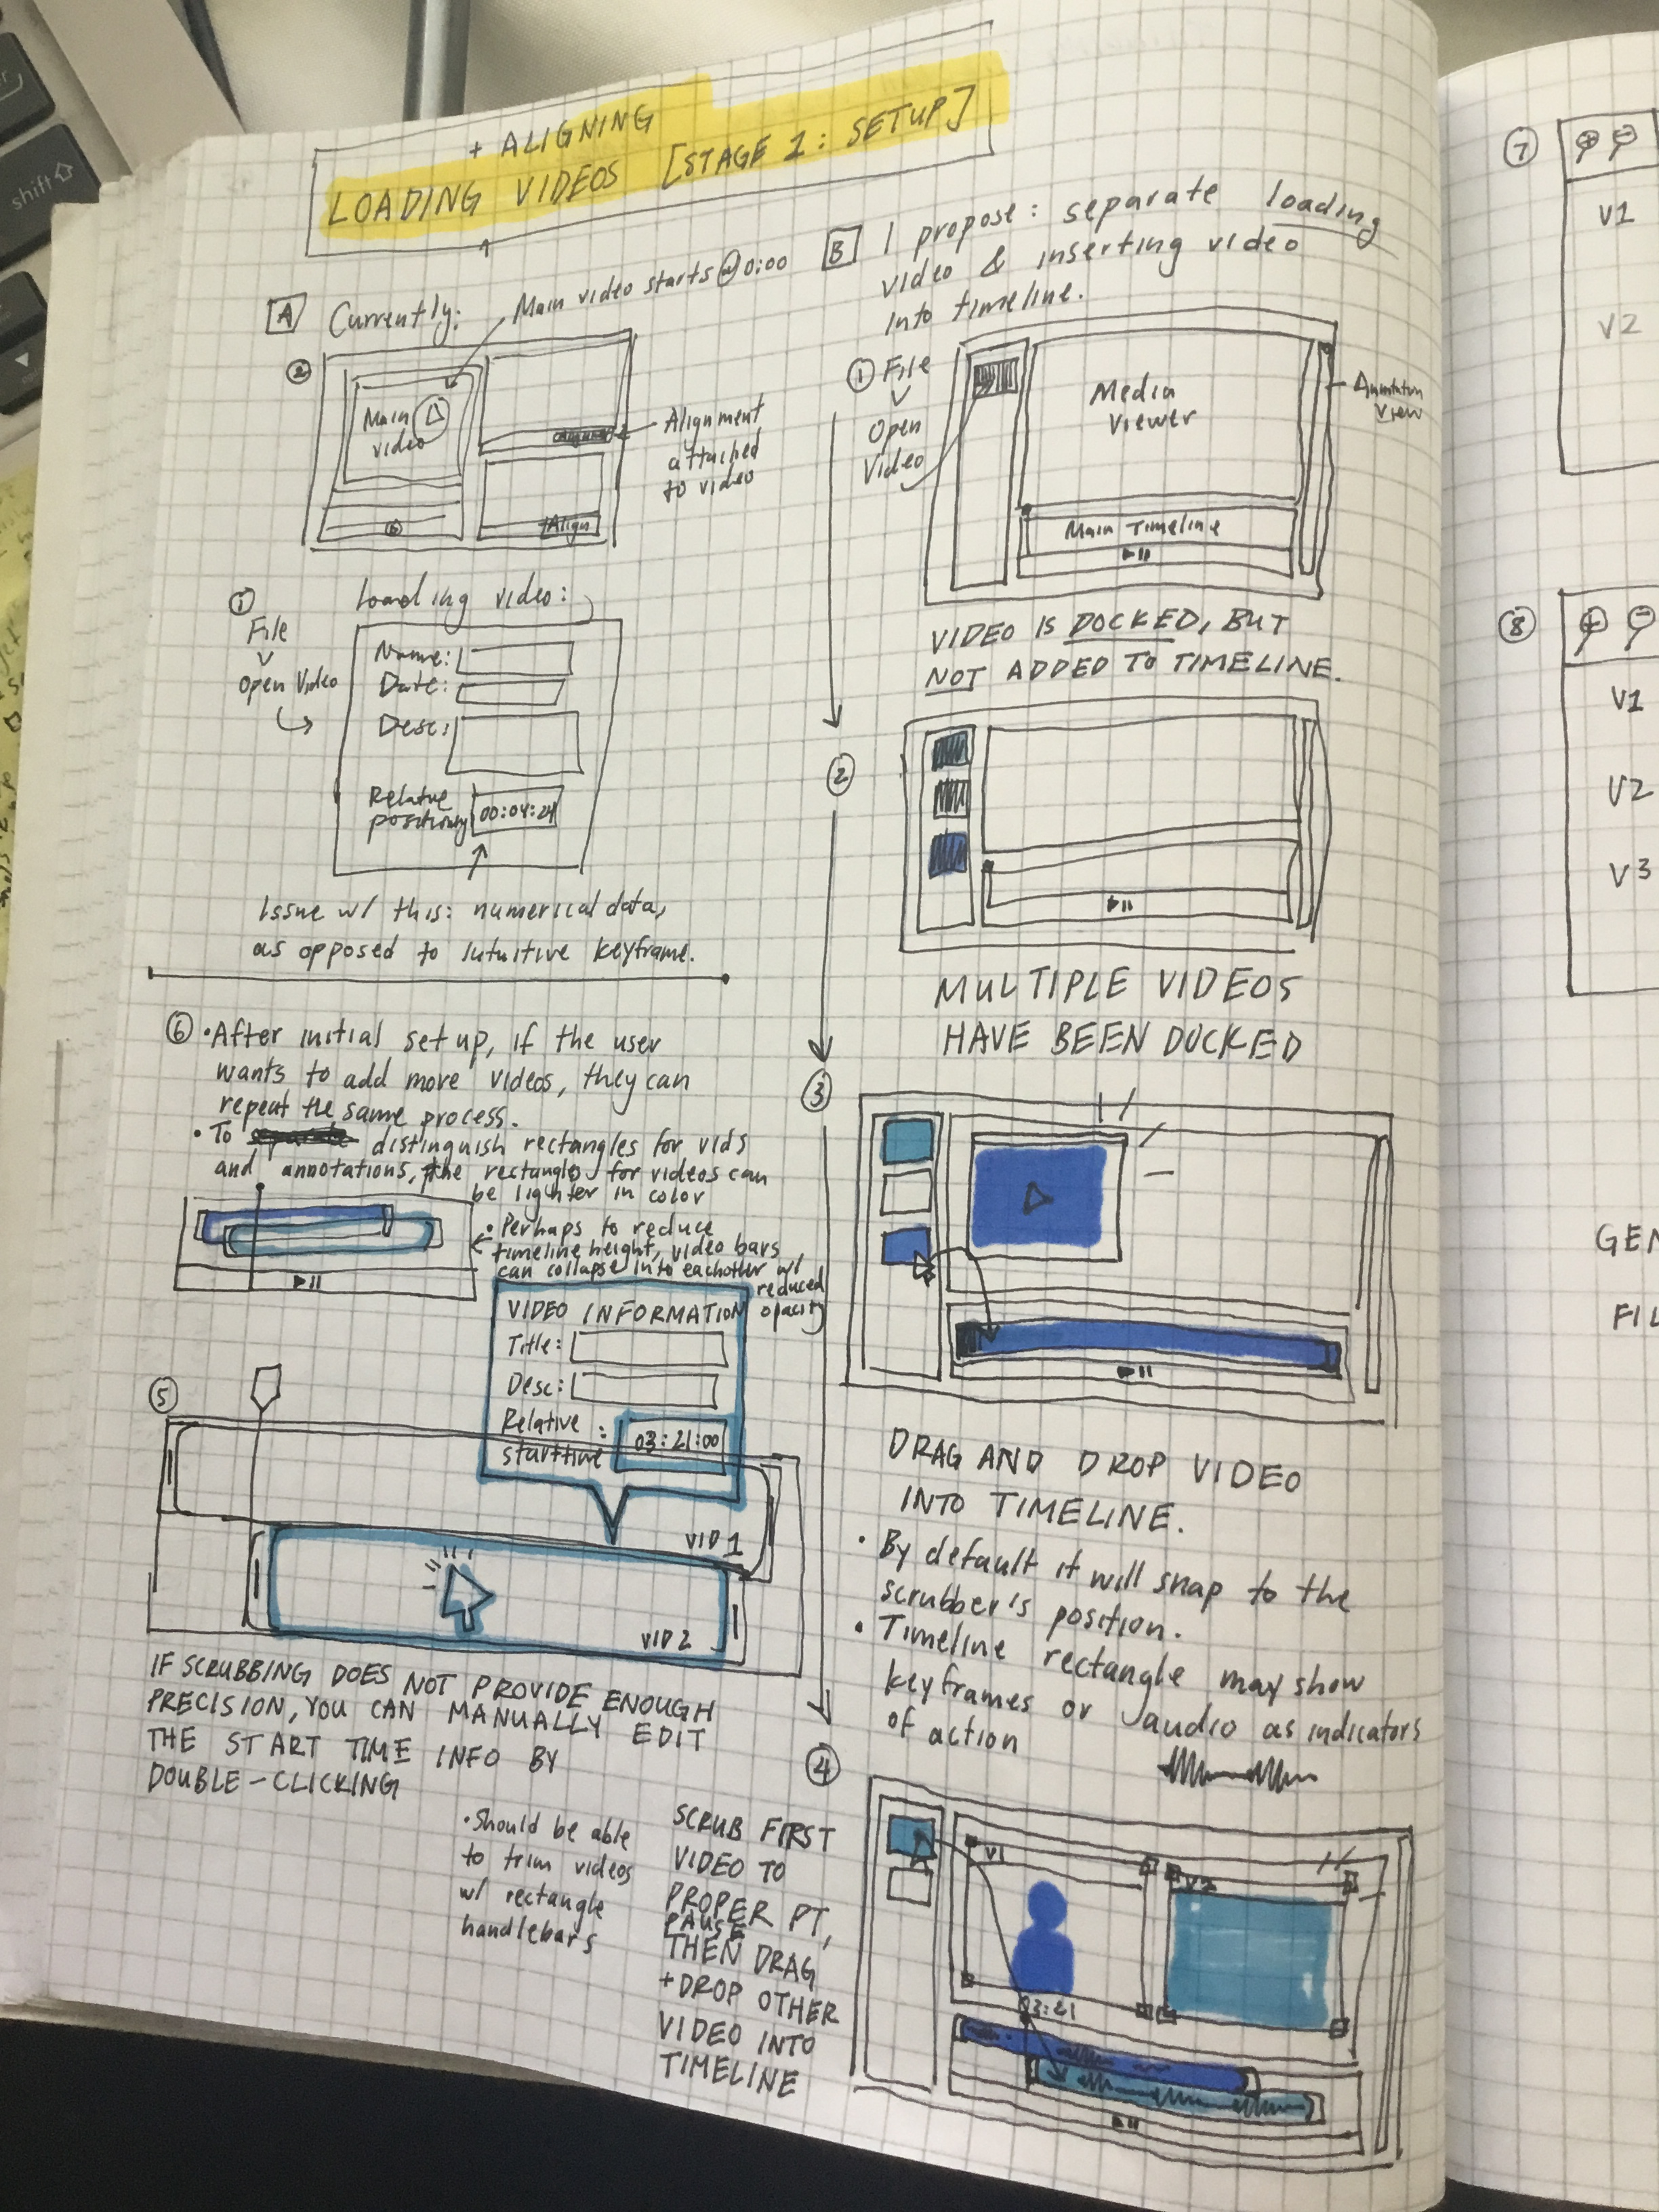
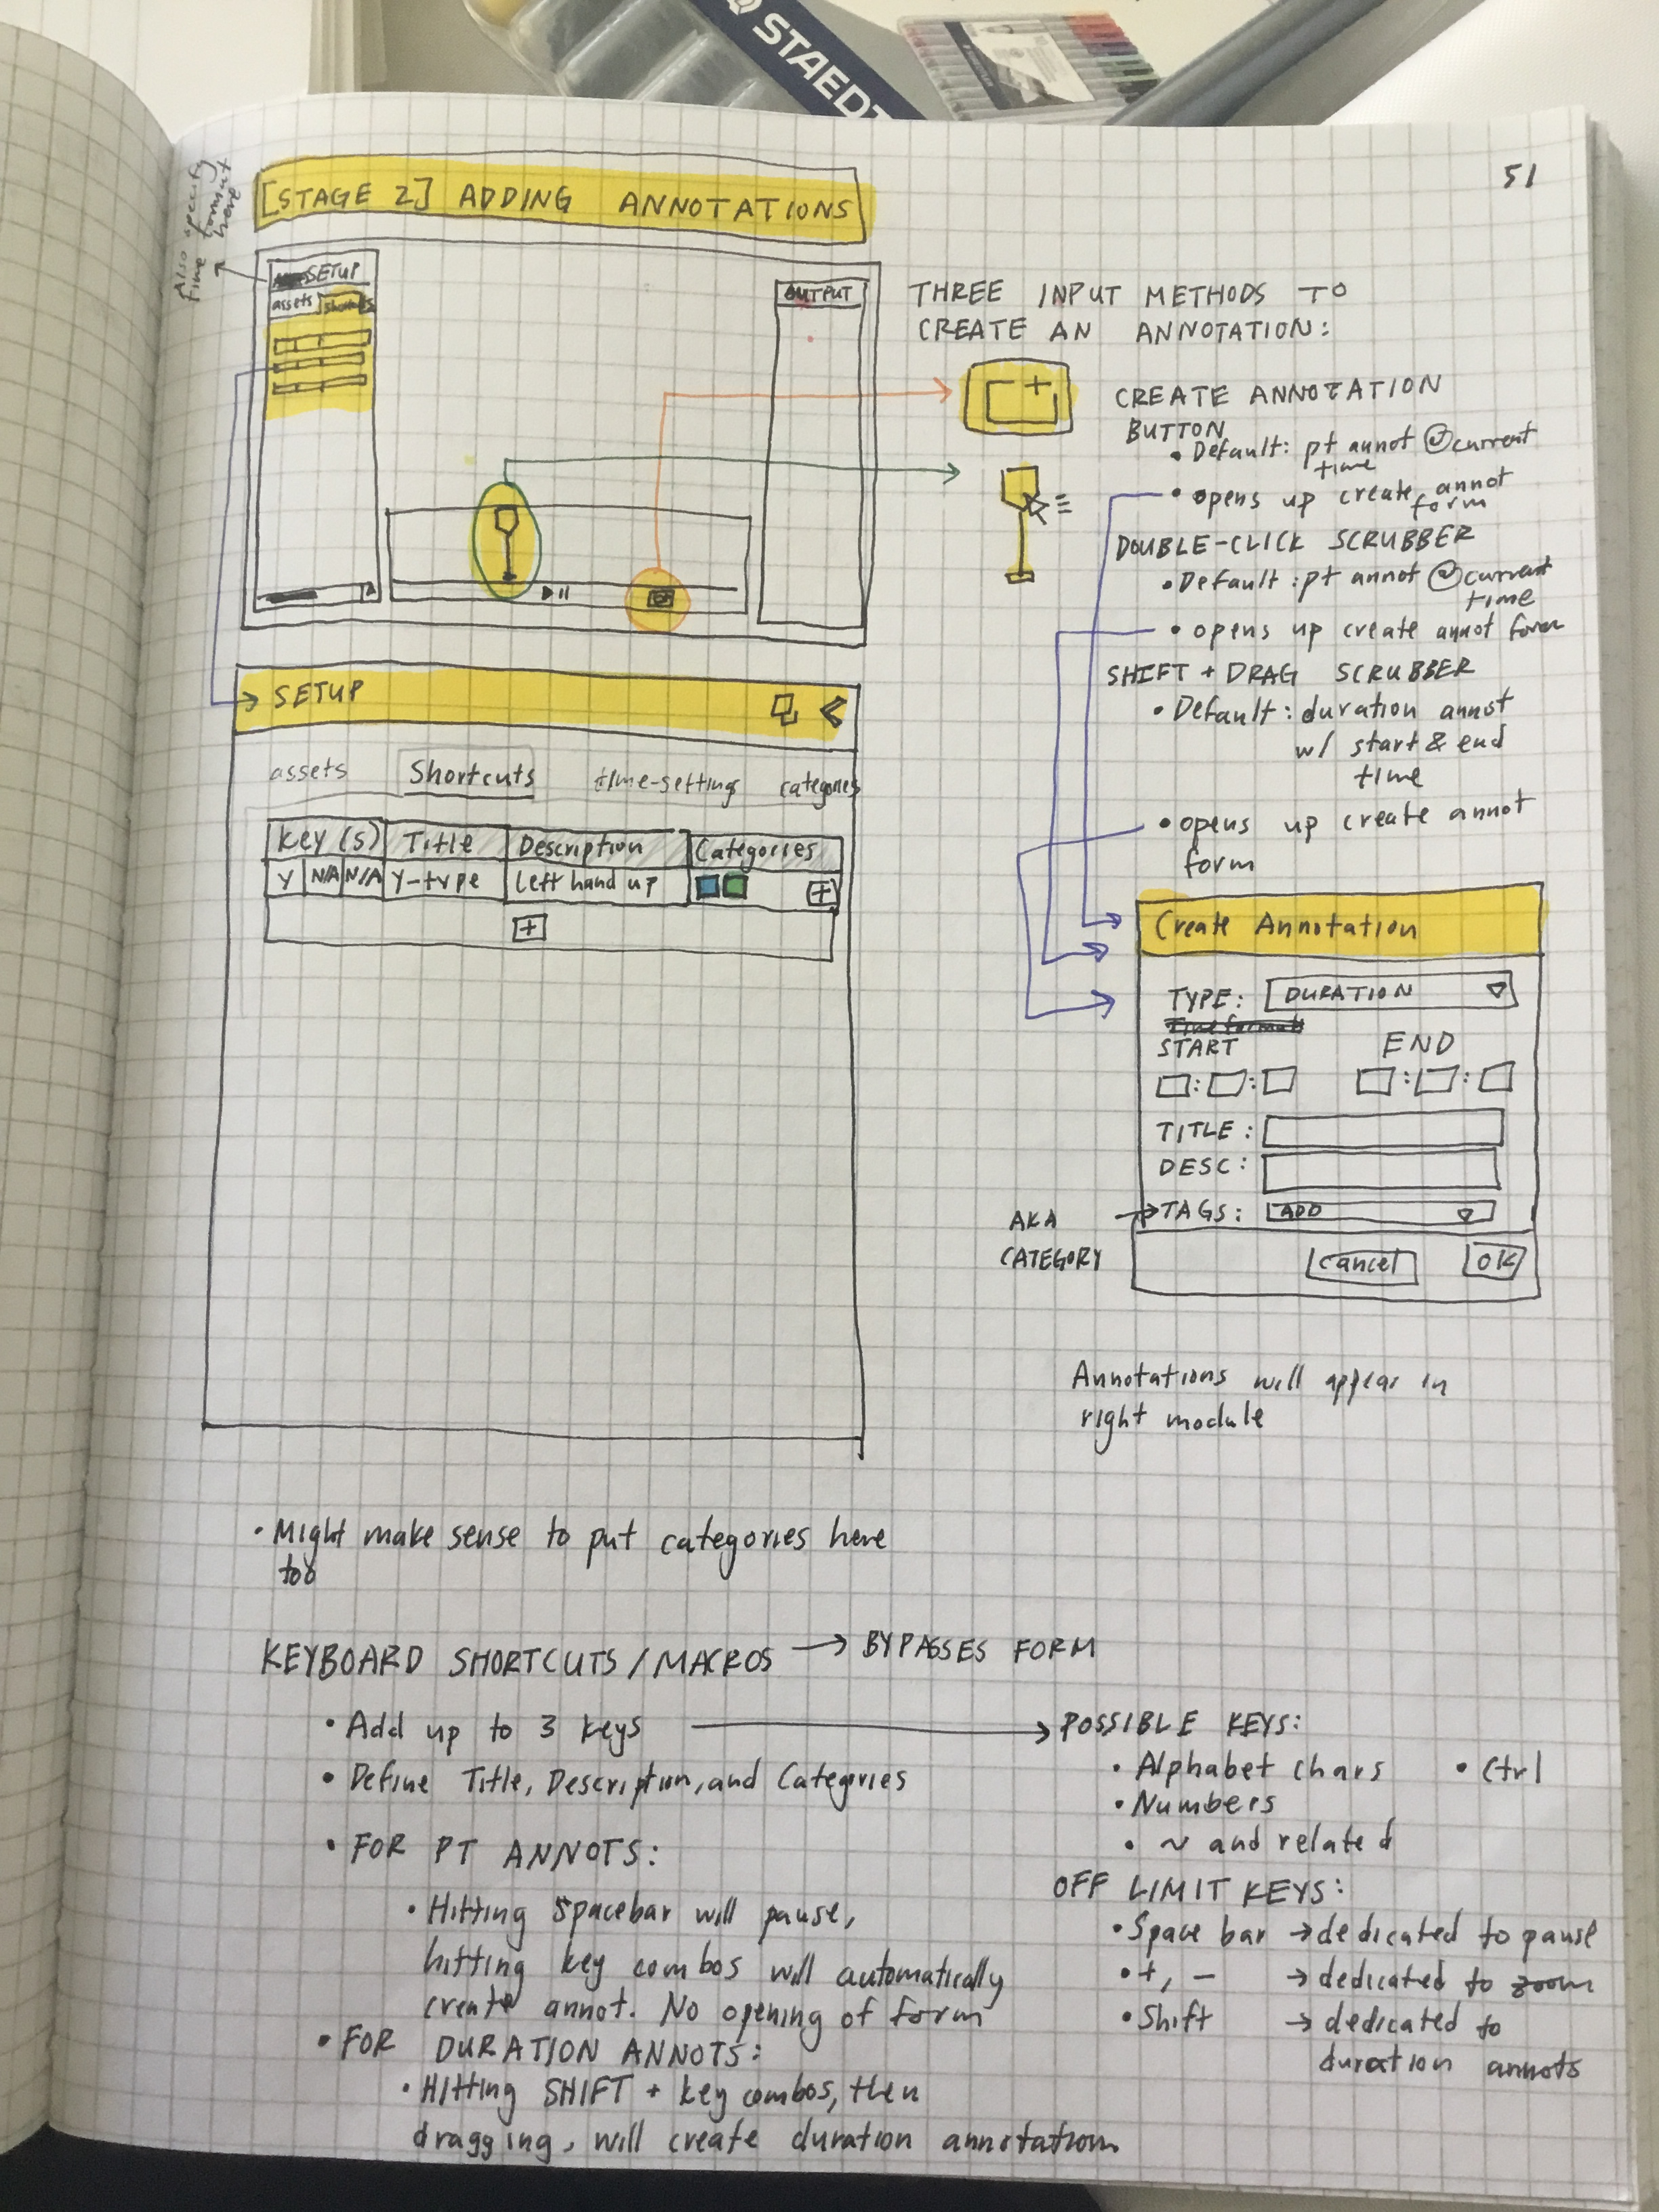
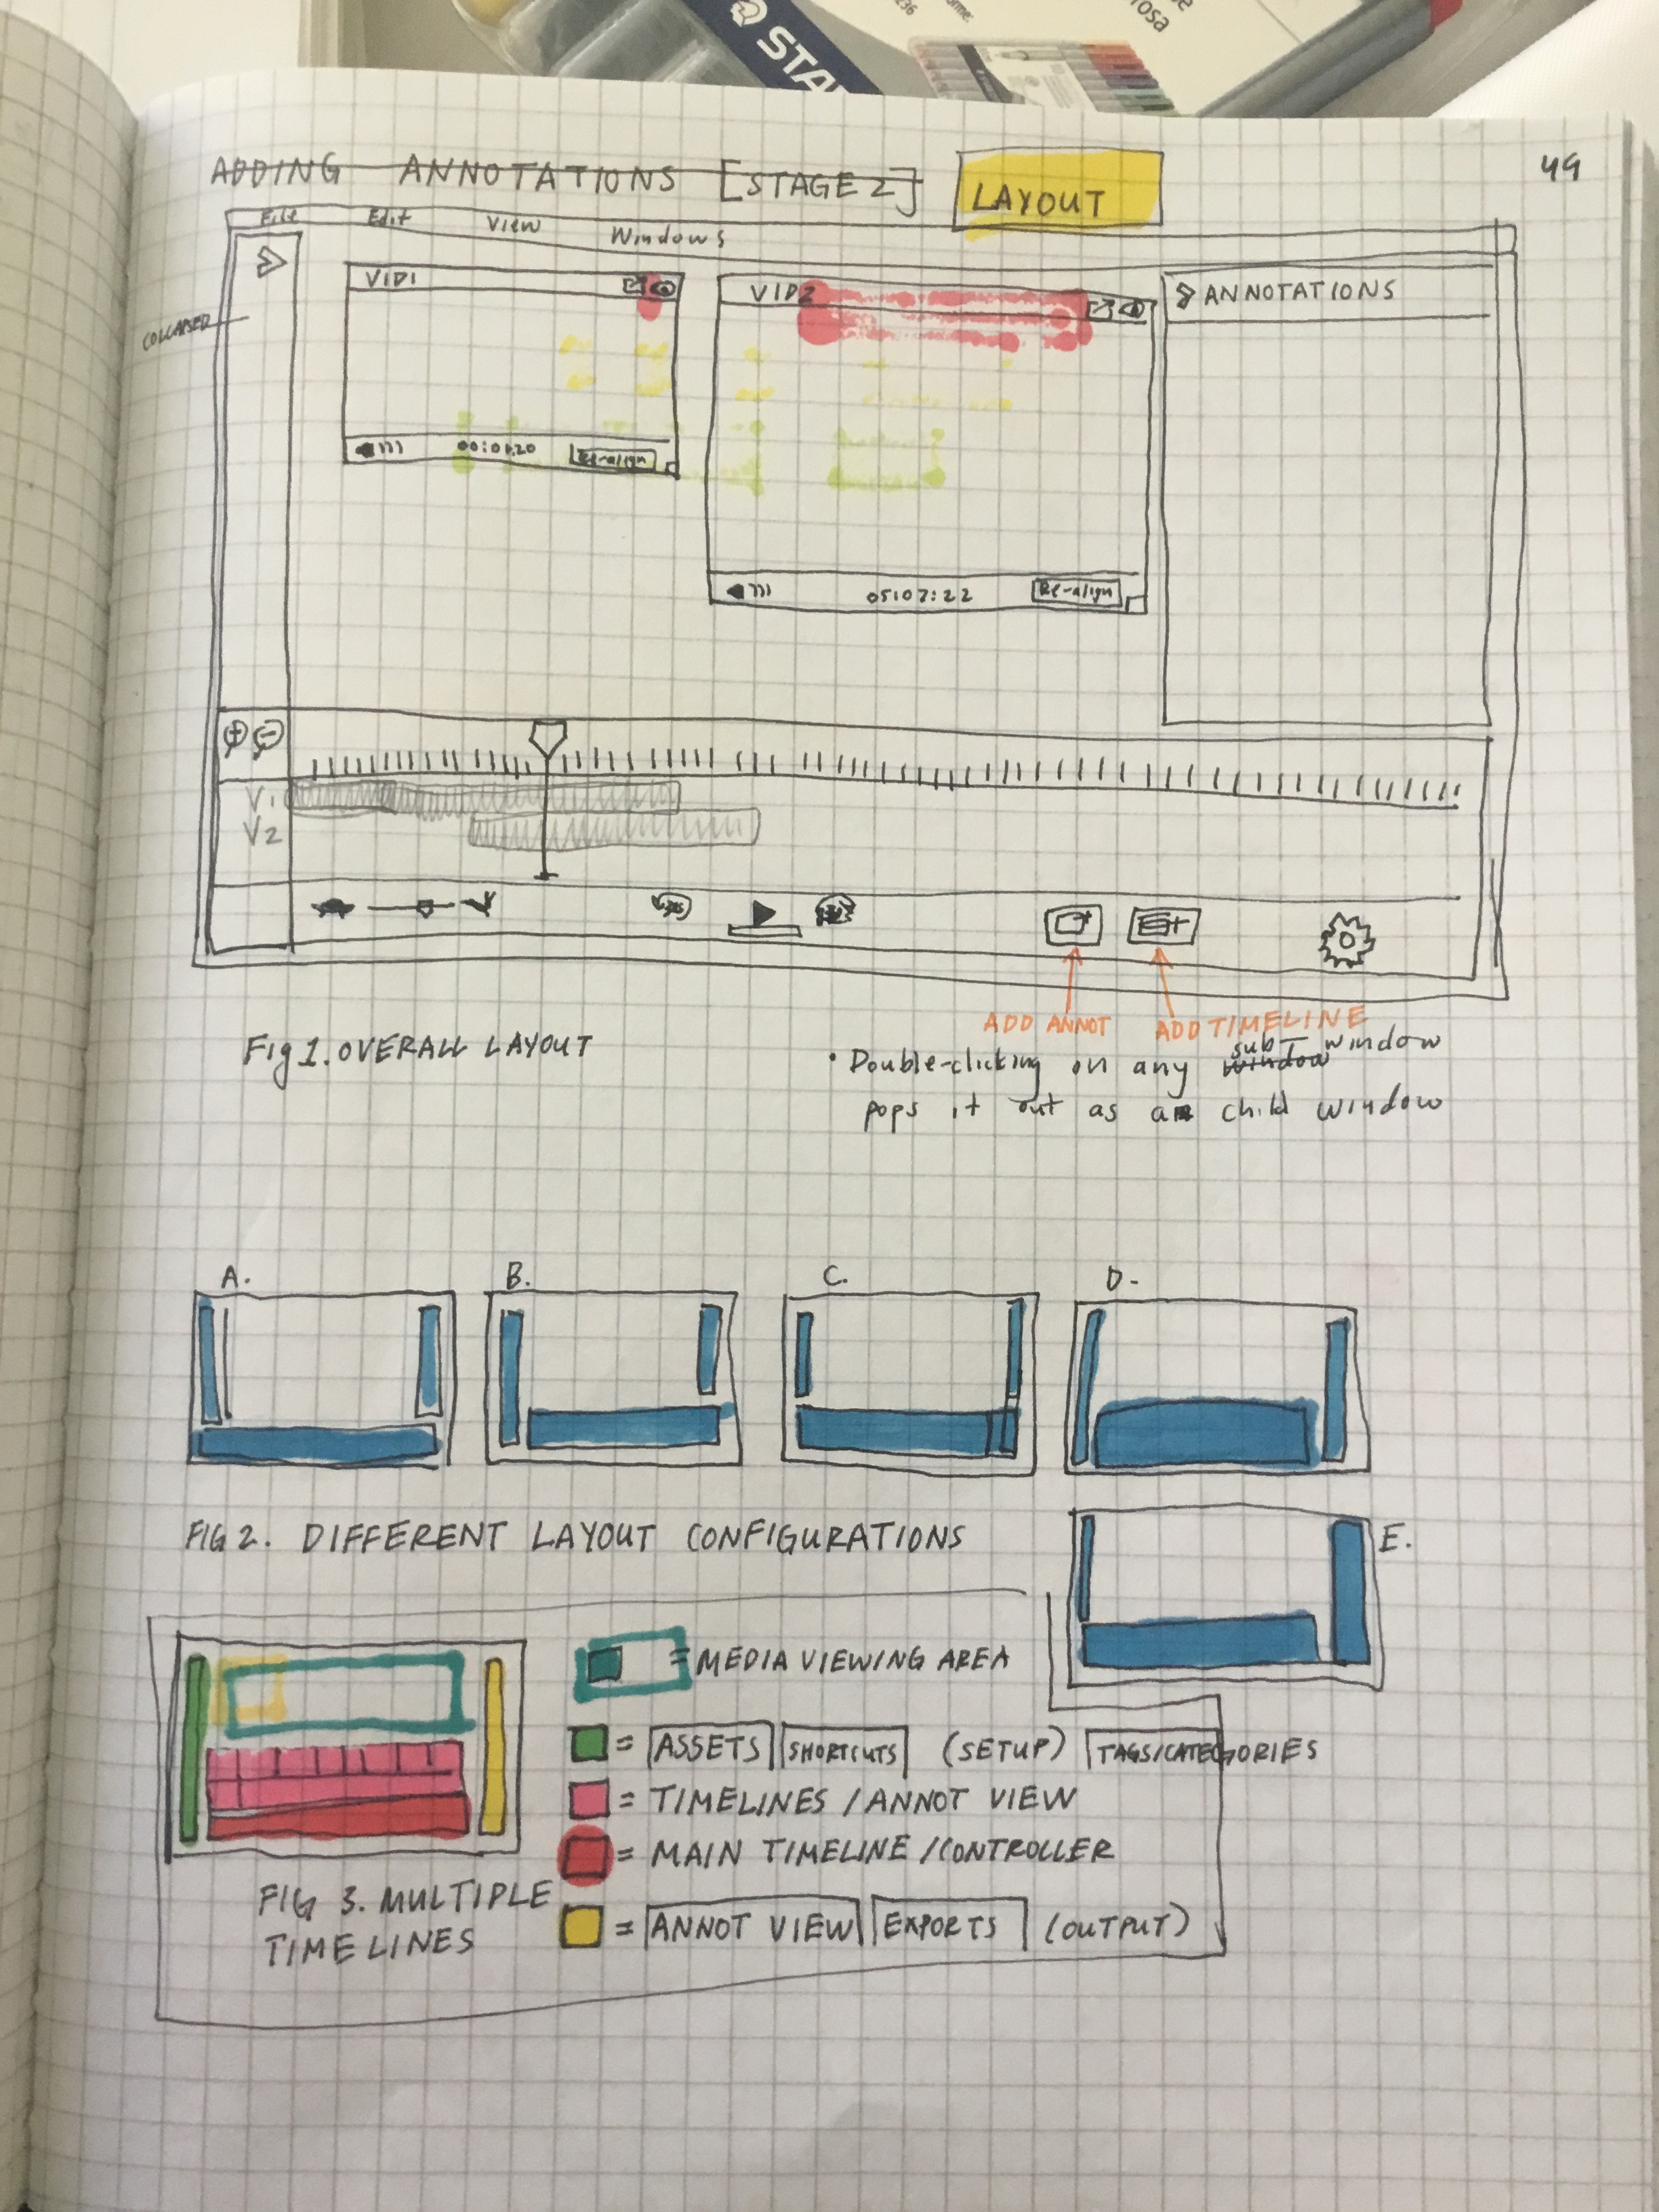
Afterwards came ideation time. I explored flows and layouts for each feature through sketches, drawing inspiration from analogous annotation or video tools, such as:
Google Docs Comments
Figma Comments
Lightworks Video Editor
Kindle Annotations
Google Docs Comments
Figma Comments
Lightworks Video Editor
Kindle Annotations
03.
Building a V1 & User Feedback
Following ideation, it came time to test whether the basic functionality of the application was possible through implementation of a basic proof-of-concept prototype.
This slide-deck demonstrates a few key features and their technical implementation:
The application builds upon three basic objects, represented as JSON objects: Videos, Annotations, and Tags.
As the codebase grew, documentation became critical for communication, managing complexity, and reference for my own future self.
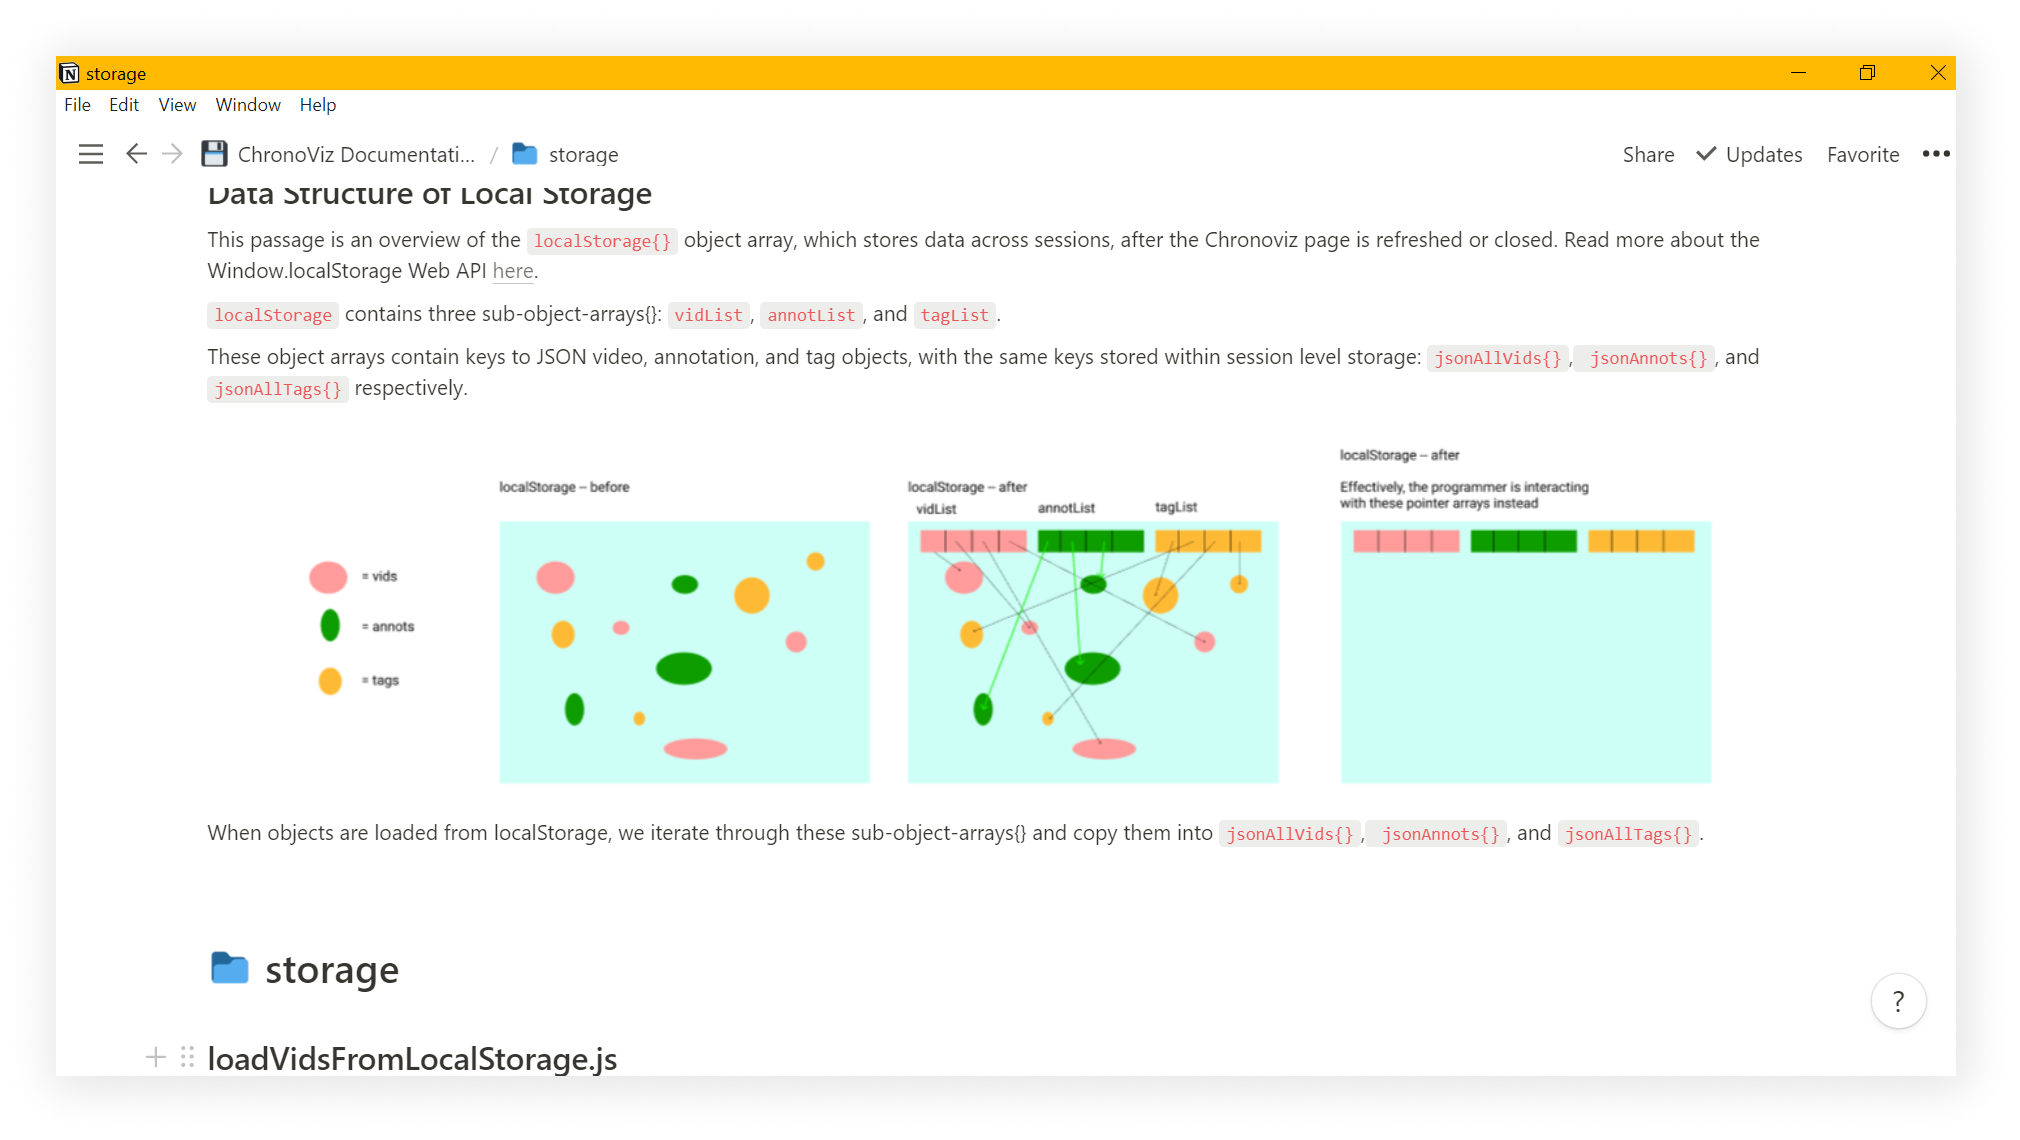
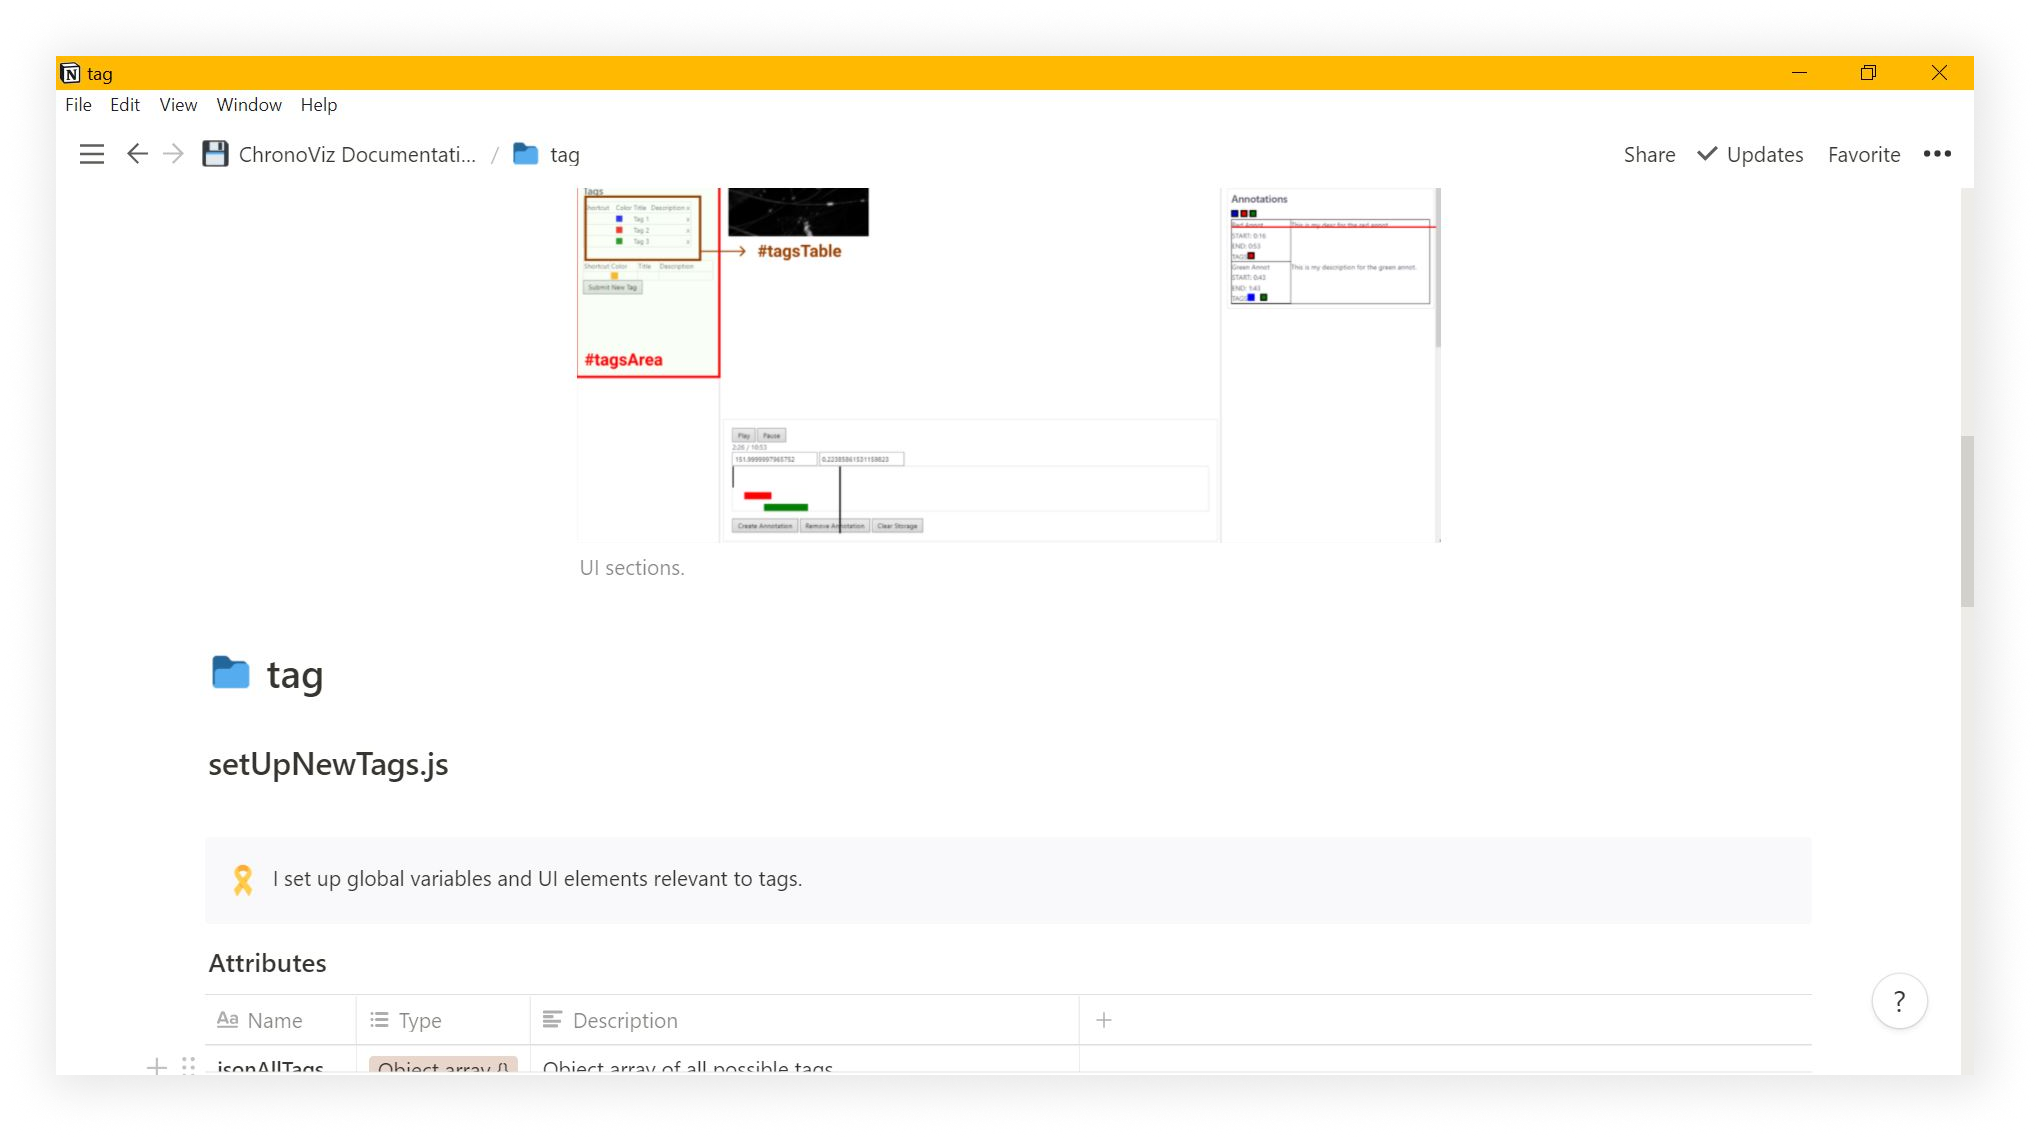
I tried to convey the underlying structure and function through a mix of diagrams, UI screenshots, text descriptions, and code snippets.
04.
Design Considerations
Talking to many of the ethnographers, it became clear that because the tool experienced repetitive use, small touches made a significant difference. Thus, I paid special attention to microinteractions throughout the application while building the v1 version.
1. MULTIWINDOW DISPLAYAllows users to "pop" out a video and drag it around on the screen, even to a second monitor
- Many tested users owned multiple monitors.
- Allowing for flexible arrangement bypasses the constraint of limited screen space when fitting many videos
2. KEYBOARD SHORTCUTSProvides users keyboard shortcuts for creating annotations, applying specific tags, navigating the timeline, etc.
- Because the users often encounter repetitive actions (e.g.: creating multiple point annotations of a specific tag), keyboard shortcuts cut down on mouse traveling time and enable the user to traverse the app with keyboard only.
3. DUAL ANNOTATION VIEWS
Annotations are rendered as timeline-visualizations as well as in a text-based table.
Annotations are rendered as timeline-visualizations as well as in a text-based table.
- Similar to Google Doc and Notion comments, affords users in-context view (timeline-visualization) as well as list view (table)
4.
OTHER MICROINTERACTIONS
Other small touches. For example: clicking on an annotation on the timeline brings the video times to the annotation start time to avoid scrubbing through the timeline.
Other small touches. For example: clicking on an annotation on the timeline brings the video times to the annotation start time to avoid scrubbing through the timeline.
- These small interactions, though small, accumulate to a more convenient experience.
05.
High-Fidelity Prototype
After several rounds of user testing the v1 application, I ordered the feedback by priority and feasibility. A few key insights emerged:
1. SIGNIFIERS:
While many of the users said the keyboard shortcuts and micro-interactions were helpful and intuitive, they were not easily discoverable on first use. To address this, I baked in more unintrusive signifiers throughout the application to help guide the user.
While many of the users said the keyboard shortcuts and micro-interactions were helpful and intuitive, they were not easily discoverable on first use. To address this, I baked in more unintrusive signifiers throughout the application to help guide the user.
2. NOTEPAD:
A feature which the original ChronoViz, as well as other video-coding software, lacked was essentially a notepad for tracking qualitative data within the application.
3. SEPARATE SETUP STAGE:
Setting up videos can be confusing, as indicators of video start times can clash with the annotation visualizations
Setting up videos can be confusing, as indicators of video start times can clash with the annotation visualizations
4. PLUG-IN’S:
Many researchers analyze a variety of temporal data beyond video data (e.g.: gesture annotation, movement tracking across 3-dimensional space). While it may not be realistic for me to catch all these edge cases, an ability for users to extend the tool by plugging in their own Javascript add-ons could be immensely useful.
Many researchers analyze a variety of temporal data beyond video data (e.g.: gesture annotation, movement tracking across 3-dimensional space). While it may not be realistic for me to catch all these edge cases, an ability for users to extend the tool by plugging in their own Javascript add-ons could be immensely useful.
Before moving on to more coding, I took the time to flesh out a more complete prototype in Figma, based on feedback, to communicate the vision and solicit further feedback.
Reflections
04.
Iteration & Features
Prioritization
Context
On-the-Go Learning
I loved this project because ...
Context
On-the-Go Learning
I loved this project because ...